2026/04/25 Prairie Operating (PROP): $1.2B oil assets selling at $0.1B market cap.Part 2.

On April 21, I wrote about Prairie Operating (PROP), an oil development company with $1.2 billion in oil field assets, yet its market capitalization hovers around only $100 million. While oil prices have been fluctuating around $100 lately, PROP only needs oil prices to exceed $60 to survive.
$60 is the "lifeline" for Prairie Operating (PROP) because it involves two costs for shale oil developers: Full-cycle Breakeven and Debt Repayment Pressure.
1. The Operating Cost "Floor" (Approx. $20–$25/bbl)
This is the most fundamental expenditure; as long as the well is producing, these costs are deducted from every barrel:
- Lease Operating Expenses (LOE): Approx. $6.14/bbl.
- Transportation and Processing: Approx. $1.32/bbl.
- Taxes (Production/Ad Valorem): Approx. $3.15/bbl.
- Cash G&A: Approx. $5.29/bbl.
- Total: Before a single barrel is even sold, approx. $16 in rigid operating costs must be deducted.
2. The "Burden" of Capital Expenditure (Approx. $25–$30/bbl)
Shale wells are characterized by extremely fast decline rates; if new wells are not continuously drilled, production will crash.
- 2026 CapEx Guidance: Approx. $210 million.
- Expected Production: Approx. 26,500 boe/d (approx. 9.67 million barrels annually).
- Amortized per barrel: Approx. $21.70/bbl. This means that to keep production from shrinking, about $22 from every barrel must be reinvested into the ground to drill new wells.
3. The Most Critical Factor: Debt Interest and Leverage (Approx. $10–$15/bbl)
- Debt Status: As of Q1 2026, the company has net debt of approx. $257 million and a large amount of Series F Preferred Stock to address.
- Interest Expense: In the current high-interest-rate environment, annual interest payments and debt repayment pressure, when spread across every barrel, require a profit margin of roughly $10–$15 to cover.
4. Summary: Why is $60 the Line of Life and Death?
Operating Costs ($16) + Maintenance Capex ($22) + Debt/Interest ($12) = $50 (Base Cash Cost).
$50 is just "barely staying alive". If oil prices drop to $60:
- Net Profit Disappears: Considering the oil price differential (the actual realized price is usually several dollars cheaper than WTI), a $60 international oil price means the company may actually only receive about $55.
- Cash Flow Fracture: At around $60, the money earned is just enough to pay workers and maintain production, leaving absolutely no surplus to repay principal or meet debt interest payments.
Therefore, $60 is the life-and-death line. At this threshold, Prairie Operating (PROP) has executed very aggressive and large-scale hedging to lock in profits, reducing its probability of bankruptcy while also capping profit explosions.
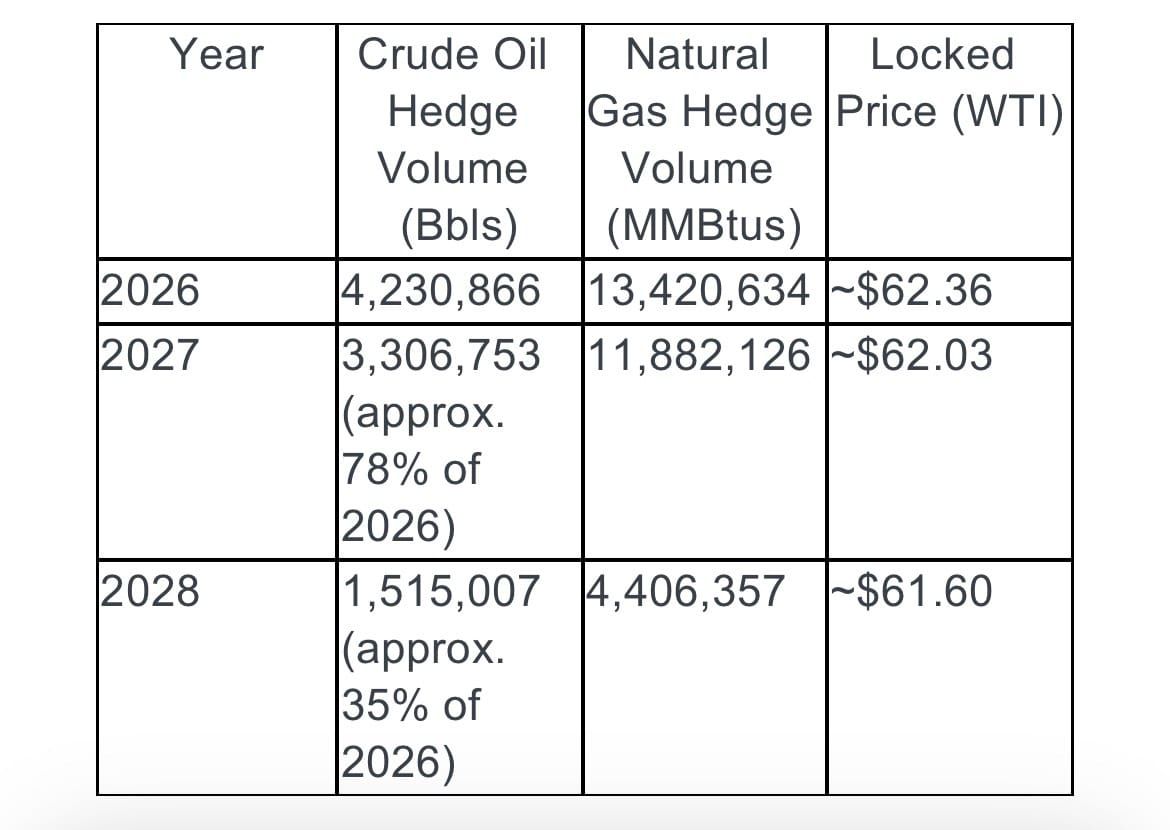
According to the latest earnings report released at the end of March 2026 and the 2026 performance guidance, the company explicitly stated in its 2025 annual report that it has locked in prices for the majority of expected production from 2026 to 2029. Hedging has locked in an EBITDA of approximately $240–$260 million for 2026. Its market cap is only $110 million.
Notably, hedging decreases year by year.
The following table:
|
Year |
Crude Oil Hedge Volume (Bbls) |
Natural Gas Hedge Volume (MMBtus) |
Locked Price (WTI) |
|
2026 |
4,230,866 |
13,420,634 |
~$62.36 |
|
2027 |
3,306,753 (approx. 78% of 2026) |
11,882,126 |
~$62.03 |
|
2028 |
1,515,007 (approx. 35% of 2026) |
4,406,357 |
~$61.60 |
Based on Hedge Volume:
- 2026: High certainty, but no explosive power. Approximately 60%–70% of the company's production this year is locked at around $62. This means even if oil prices rise to $100 this year, the profit is predetermined. Its primary task is to repay debt and pay $200 million in CapEx.
- 2027–2028: Beginning to "unwind," welcoming elasticity. The hedge ratio drops significantly. This means starting in 2027, if oil prices remain high, the proportion of "market-priced" oil PROP sells will increase significantly. If oil is $80 by then, profits will see explosive growth compared to 2026.
Why are prices locked near $62? You will find all hedge prices are very close ($61–$62). This is because PROP’s creditors (lending banks) usually require "breakeven insurance." The banks calculated that as long as the company can sell oil at $62, it will definitely not go bankrupt and can pay its interest.
The current $110 million market cap is a "phased unlocking" script for the next two years:
- Phase One (2026): "Repay Debt." Stock performance depends on how fast it can reduce debt.
- Phase Two (2027–2028): If it survives 2026, "forward oil prices" release profits. If oil prices stay firm, due to the lower hedge ratio, PROP will truly demonstrate the super-profit nature of energy stocks.
2026 Performance Elasticity Simulation
1. Core Simulation Parameters (2026 Forecast)
- Total Production Target: Approx. 9.855 million boe (using the median of 27,000 boe/d).
- Crude Oil Ratio: Approx. 50% (i.e., 4.93 million barrels of crude).
- Hedge Position: 4.23 million barrels of crude hedged for 2026 at an average price of $62.36.
- Unhedged Production: Approx. 700,000 barrels of crude exposed to market prices.
- Rigid Expenses: CapEx approx. $210 million + Operating Costs approx. $150 million + interest/taxes, etc.
2. 2026 Performance Elasticity Stress Test Since approx. 86% of crude production is locked near $62, the profit boost from rising oil prices in 2026 is very sluggish. Below is the simulation estimate at different oil prices:
|
WTI Oil Price |
2026 Est. Revenue (inc. Gas/NGL) |
Est. Adjusted EBITDA |
Free Cash Flow (FCF) |
Evaluation |
|
$60 |
~$390M |
$240M |
~$10M (Breakeven) |
Survival Mode: Just enough for drilling and interest. |
|
$70 |
~$410M |
$250M |
~$20M |
Slow Deleveraging: Some spare cash to repay principal. |
|
$80 |
~$430M |
$260M |
~$30M |
Robust: Cash flow improves, debt pressure eases. |
|
$90 |
~$450M |
$270M |
~$40M |
Dragged by Hedges: Price rose $30, but profit only rose $30M. |
|
$100 |
~$470M |
$280M |
~$50M |
Missed Opportunity: Most gains donated to hedge counterparties. |
3. Why is there "no movement" in 2026? As shown above, oil prices jumping from $60 to $100 (66% increase) only increases EBITDA from $240M to $280M (only 16% increase).
- Hedge "Tightening Spell": 2026 is the year of maximum debt pressure, so management essentially bet their "lives" on the $62 floor price.
- $110M Market Cap vs. $250M EBITDA: Even at $60 oil, the EV/EBITDA valuation is only about 2x (including debt). This means it is cheap now not because it isn't profitable, but because the market is worried it can't pay back that $250M debt.
4. Conclusion and Probabilistic Thinking
- 2026: Watch and wait. Regardless of oil prices, this year's net profit is largely set (approx. $55–$65M); I am still surprised by the current $100M market cap. Stock price appreciation depends not on oil prices, but on the speed of debt reduction.
- True Elasticity: 2027–2028. As hedge volumes halve, if oil is at $90 then, profits will double. That is when the market cap leaps from $110M to $500M or even $1B.
2027 is the "Profit Release Year"
The simulation logic for 2027 undergoes a qualitative change. The two most core changes are: Hedge volume "halving" and reduced debt burden.
1. 2027 Simulation Core Data (Estimated)
- Hedge Ratio: Crude hedge volume drops from approx. 4.23M barrels in 2026 to approx. 3.3M barrels (reducing the "shackles" by about 1M barrels).
- Market Exposure: The proportion of production sold at market prices increases from 15% to over 30%.
- Revenue Outlook: Analyst consensus expects 2027 revenue to grow to $450–$500 million, with EBITDA estimated to rise to $340–$360 million.
2. 2027 Performance Elasticity Stress Test (vs. 2026) In 2027, the "leverage effect" of rising oil prices on the stock price will be much more pronounced than in 2026:
|
WTI Oil Price |
Est. 2027 EBITDA |
Free Cash Flow (FCF) |
Change vs. 2026 |
|
$60 |
~$310M |
~$60M |
Significant Improvement: Less interest, more money. |
|
$70 |
~$340M |
~$90M |
Profitable: Can perform more asset acquisitions or dividends. |
|
$80 |
~$380M |
~$130M |
Explosion: FCF is over 4x that of 2026 at the same oil price. |
|
$90 |
~$420M |
~$170M |
Elasticity Released: Starts enjoying premiums from high oil prices. |
|
$100 |
~$460M |
~$210M |
"Bicycle to Motorcycle": FCF exceeds the current total market cap. |
3. Why is 2027 the starting point for "excess profits"?
- Debt Interest "Ebb Tide": According to the April 9, 2026 announcement, the company prepaid $13.7M in Series F Preferred principal and significantly cut warrant dilution. By 2027, because 2026 earnings are mainly used for debt, interest expenses will drop sharply; saved interest becomes direct profit.
- Hedge Cost "Unbinding": In 2026, you sell $100 oil but only get $62; in 2027, you have more oil to sell at $80, $90, or even $100. This widening "scissors gap" is the driver for doubling the valuation in 2027.
- Production Stabilization: After intensive drilling in 2026 (CapEx $210M), 2027 enters the harvest period, and CapEx pressure will relatively decrease.
Since 2027 is the starting point, can they survive 2026?
1. The "Three Mountains" hanging over 2026 Whether PROP survives depends on these three variables:
- CapEx: 2026 estimate of $200–$220 million. This is necessary for drilling to maintain production and cannot be cut.
- Debt and Equity Dilution: Debt of approx. $257 million.
- Cash Flow Matching: 2026 estimated EBITDA of $240–$260 million.
2. Probability Simulation: Can they survive 2026?
- Scenario A: Narrow Escape (Prob: 75%)
- Logic: As long as oil doesn't stay below $60, the hedges (locked at $62) provide a stable cash floor.
- Status: 2026 earnings ($250M EBITDA) minus drilling ($210M CapEx) leaves $40M, just enough for interest and operations.
- Conclusion: Survival will be cramped with no dividends; the stock may languish due to warrant dilution, but the company itself won't collapse.
- Scenario B: Debt Restructuring/Passive Dilution (Prob: 20%)
- Logic: Oil drops below $60 and stays there for months.
- Status: Even with hedges, cash flow becomes extremely tight, unable to pay for both drilling and interest. Forced large-scale share issuance to pay debt.
- Conclusion: The company survives, but EPS might shrink by 50%+ due to frantic issuance.
- Scenario C: Bankruptcy/Liquidation (Prob: 5%)
- Logic: Oil below $50 plus banks pulling loans early.
- Conclusion: For a $100M market cap company, this probability is small but exists.
3. Why I think they will "likely survive"?
- High Hedge Coverage: 86% of 2026 production is locked. This is like a critical illness insurance; unless the oil field has an accident, this money is guaranteed.
- Just Defused the "Equity Bomb": In early April 2026, the company reached an agreement with Series F Preferred shareholders to reduce potential dilution from 77M shares to 34M shares and extended warrant exercise times. Creditors also want to keep it alive to collect debt as potential is released.
My Strategy: Option Thinking - Small Initial Position - Add Position After Dilution
A small initial position means even in the 5% "bankruptcy extreme," total portfolio loss is controlled. This fits the "limited loss, unlimited gain" characteristics of an option. Why add after dilution? After dilution, the certainty of the company surviving to 2027 to release profits increases; add to the position when certainty is enhanced.
Focus on these three signals:
- Signal A: July 8, 2026 (Warrant Reset Period): A key node regarding dilution pressure from previous agreements.
- Action: If announced "Warrants Cancelled": Risk vanishes instantly; buy/add even if price rose. If announced "Warrants Issued": Wait for the "Final Washout" drop; enter once it bottoms, as the default risk has disappeared even if the share count grew.
- Signal B: 2026 Q3 Earnings (Op-Cost Verification): Observe if LOE stays around $6. As long as costs are controlled, hedges cover drilling.
- Signal C: Debt Repayment Progress: Any use of 2026 cash flow to retire principal or preferred stock directly translates into increased equity value.
Final Value of the Company:
- Asset Reserve Value (PV-10): As of end-2025, PROP’s Proved Reserves in the DJ Basin are valued at approx. $1.22 billion (PV-10 discounted value).
- Current Market Cap (April 25, 2026): $112 million.
- Strong "Passive Defense": Even if PROP fails to operate, its assets are hard currency. In liquidation, selling $1.2B in assets to pay $360M in debt still leaves a remainder far exceeding the current $110M market cap.
- High Acquisition Potential: "Big assets, small cap, high debt" companies are favorite prey for majors (like Chevron or Occidental).
- Time is a Friend: As 200+ wells produce, and the $360M debt is slowly repaid, the "missing" $1.1 billion in value ($1.22B assets minus $110M market cap) will act like "crustal uplift," pushing the stock price up.
Risk Warning: The author holds a small position in this stock with an "option-trading" mindset. Investors should be prepared for the possibility of the stock price going to zero.
Le 21 avril, j’ai écrit sur Prairie Operating (PROP), une société de développement pétrolier possédant 1,2 milliard de dollars d’actifs pétroliers, mais dont la capitalisation boursière ne tourne qu'autour de 100 millions de dollars. Alors que le prix du pétrole oscille actuellement autour de 100 $, PROP n’a besoin que d’un baril supérieur à 60 $ pour survivre.
Les 60 $ constituent la « ligne de survie » de Prairie Operating (PROP) car ils touchent à deux coûts critiques pour les développeurs de pétrole de schiste : le seuil de rentabilité complet (Full-cycle Breakeven) et la pression du remboursement de la dette.
1. Le « plancher » des coûts d’exploitation (environ 20-25 $/baril)
Il s’agit des dépenses fondamentales : tant que le puits produit, ces frais sont déduits de chaque baril :
- Frais d'exploitation de location (LOE) : Environ 6,14 $/baril.
- Transport et traitement : Environ 1,32 $/baril.
- Taxes (Production/Ad Valorem) : Environ 3,15 $/baril.
- Frais généraux et administratifs (Cash G&A) : Environ 5,29 $/baril.
- Total : Avant même la vente d'un baril, environ 16 $ de coûts d'exploitation rigides sont déjà déduits.
2. Le « fardeau » des dépenses d'investissement (environ 25-30 $/baril)
Les puits de schiste se caractérisent par un déclin de production extrêmement rapide ; sans forage continu de nouveaux puits, la production s'effondre.
- Objectif CapEx 2026 : Environ 210 millions $.
- Production attendue : Environ 26 500 bep/j (environ 9,67 millions de barils par an).
- Amortissement par baril : Environ 21,70 $/baril. Cela signifie que pour maintenir la production, environ 22 $ sur chaque baril doivent être réinjectés dans le sol pour de nouveaux forages.
3. Le facteur le plus critique : Intérêts de la dette et levier (environ 10-15 $/baril)
- État de la dette : Au premier trimestre 2026, la société affiche une dette nette d'environ 257 millions $ et doit gérer une quantité importante d'actions privilégiées de série F.
- Charges d'intérêts : Dans l'environnement actuel de taux d'intérêt élevés, les intérêts annuels et la pression du remboursement, rapportés à chaque baril, nécessitent une marge de profit d'environ 10 à 15 $ pour être couverts.
4. Résumé : Pourquoi 60 $ est-il la ligne de vie ou de mort ?
Coûts d'exploitation (16 $) + CapEx de maintenance (22 $) + Dette/Intérêts (12 $) = 50 $ (Coût monétaire de base).
À 50 $, la société « survit à peine ». Si le prix du pétrole tombe à 60 $ :
- Le bénéfice net disparaît : Compte tenu de la décote du prix du pétrole (le prix réel perçu est souvent inférieur de quelques dollars au WTI), un WTI à 60 signifie que l'entreprise ne touche réellement que 55.
- Rupture de flux de trésorerie : À environ 60 $, l'argent gagné suffit juste à payer les ouvriers et à maintenir la production, ne laissant absolument aucun surplus pour rembourser le capital ou les intérêts de la dette.
C’est pourquoi 60 $ est le seuil critique. À ce niveau, Prairie Operating (PROP) a mis en place une stratégie de couverture (hedging) très agressive pour verrouiller ses profits, réduisant ainsi sa probabilité de faillite tout en plafonnant son potentiel d'explosion des bénéfices.
Selon le dernier rapport financier de fin mars 2026, la société a bloqué les prix pour la majorité de sa production prévue entre 2026 et 2029. La couverture a sécurisé un EBITDA d'environ 240 à 260 millions pour 2026. Pourtant, sa capitalisation n'est que de 110 millions.
Il est à noter que la part couverte diminue d'année en année.
|
Année |
Volume de couverture pétrole (Bbls) |
Volume de couverture gaz (MMBtus) |
Prix bloqué (WTI) |
|
2026 |
4 230 866 |
13 420 634 |
~62,36 $ |
|
2027 |
3 306 753 (env. 78% de 2026) |
11 882 126 |
~62,03 $ |
|
2028 |
1 515 007 (env. 35% de 2026) |
4 406 357 |
~61,60 $ |
Analyse selon les volumes de couverture :
- 2026 : Haute certitude, mais pas d'explosivité. Environ 60 à 70 % de la production est bloquée autour de 62 $. Même si le pétrole monte à 100 $, les gains sont prédéfinis. La mission prioritaire est de rembourser la dette et de financer les 200 millions $ de CapEx.
- 2027-2028 : Début de la « libération ». Le ratio de couverture chute. Si le pétrole reste élevé, la part vendue au prix du marché augmentera considérablement. Si le pétrole est à 80 $ d'ici là, les profits connaîtront une croissance explosive par rapport à 2026.
Pourquoi les prix sont-ils bloqués vers 62 $ ? C’est parce que les créanciers (banques) exigent généralement une « assurance de rentabilité ». Les banques ont calculé qu'en vendant à 62 $, l'entreprise ne fera pas défaut.
La capitalisation actuelle de 110 millions $ est un scénario de « déblocage par étapes » :
- Phase 1 (2026) : « Remboursement ». La performance boursière dépendra de la rapidité de désendettement.
- Phase 2 (2027-2028) : Si elle survit à 2026, les prix du pétrole « à terme » libéreront les profits. C’est là que PROP montrera la rentabilité brute typique des valeurs énergétiques.
Simulation de l’élasticité des performances pour 2026
1. Paramètres de simulation (Prévisions 2026)
- Objectif de production totale : Env. 9,855 millions de bep.
- Ratio pétrole : Env. 50 %.
- Position couverte : 4,23 millions de barils à 62,36 $.
- Production non couverte : Env. 700 000 barils exposés au prix du marché.
2. Test de résistance (Stress Test) 2026 Comme 86 % de la production de brut est bloquée vers 62 $, la hausse du pétrole en 2026 a peu d'impact sur les profits :
|
Prix du pétrole WTI |
Revenus est. 2026 |
EBITDA ajusté est. |
Flux de trésorerie libre (FCF) |
Évaluation |
|
60 $ |
~390 M$ |
240 M$ |
~10 M$ (Équilibre) |
Mode survie : juste assez pour forer et payer les intérêts. |
|
70 $ |
~410 M$ |
250 M$ |
~20 M$ |
Désendettement lent. |
|
80 $ |
~430 M$ |
260 M$ |
~30 M$ |
Robuste : la pression de la dette s'allège. |
|
100 $ |
~470 M$ |
280 M$ |
~50 M$ |
Opportunité manquée : les gains profitent aux contreparties de couverture. |
3. Pourquoi l'action « ne bouge pas » en 2026 ? Même si le pétrole grimpe de 66 % (60 à 100), l’EBITDA n’augmente que de 16 %. Le marché s'inquiète surtout de savoir si l'entreprise pourra rembourser ses 250 millions $ de dettes.
2027 : L’année de la libération des profits
Le passage à 2027 change tout : la couverture diminue de moitié et le fardeau de la dette s'allège.
|
Prix du pétrole WTI |
EBITDA est. 2027 |
Flux de trésorerie libre (FCF) |
Changement vs 2026 |
|
60 $ |
~310 M$ |
~60 M$ |
Amélioration nette. |
|
80 $ |
~380 M$ |
~130 M$ |
Explosion : le FCF est 4x supérieur à celui de 2026. |
|
100 $ |
~460 M$ |
~210 M$ |
Incroyable : le FCF dépasse la capitalisation boursière actuelle. |
Conclusion et stratégie
La survie en 2026 est probable à 75 %. Les risques de faillite sont limités par la couverture massive et la renégociation récente des actions privilégiées.
Ma stratégie : Considérer cet investissement comme une option d'achat. Prendre une petite position initiale et renforcer après d'éventuelles dilutions de capital (warrants).
Signaux à surveiller :
- Signal A (8 juillet 2026) : Date clé pour les warrants. Si les warrants sont annulés, le risque disparaît ; s'ils sont émis, attendre la chute finale du cours pour acheter.
- Signal B (Résultats T3 2026) : Vérifier que les coûts d'exploitation restent stables à 6 $.
- Signal C : Tout remboursement anticipé de la dette.
Valeur finale : Avec des réserves évaluées à 1,22 milliard $ (PV-10) pour une capitalisation de seulement 112 millions $, le potentiel de revalorisation ou de rachat par un géant du secteur (Chevron, Occidental) est immense. Le temps joue en faveur de l'investisseur : chaque dollar de dette remboursé est une valeur qui revient directement à l'actionnaire.
在4月21日我写了Prairie Operating (PROP) ,这是一家有12亿油田资产的石油开发公司,却只在市值1亿左右徘徊。这几天油价在100左右徘徊,而PROP只要油价超过60就能活,
$60 是 Prairie Operating (PROP) 的“生命线”,是因为这涉及到页岩油开发商的两个成本:全口径盈亏平衡成本(Full-cycle Breakeven) 和 偿债压力。
1. 运营成本的“地板”(约 $20-$25/桶)
这是最基础的支出,只要井在出油,每一桶油都要扣掉这些钱:
- 租赁运营费用 (LOE): 约 $6.14/桶。
- 运输与加工: 约 $1.32/桶。
- 税收 (生产税/从价税): 约 $3.15/桶。
- 现金管理费 (Cash G&A): 约 $5.29/桶。
- 合计: 每一桶油还没卖出去,先要扣掉约 $16 的刚性运营成本。
2. 资本开支的“重担”(约 $25-$30/桶)
页岩油井的特点是“衰减极快”,如果不持续打新井,产量会迅速暴跌。
- 2026年CapEx指引: 约 $2.1 亿。
- 预期产量: 约 26,500 桶/日(全年度约 967 万桶)。
- 摊销到每桶: 约 $21.70/桶。这意味着,为了维持产量不萎缩,每一桶油里必须拿出 $22 左右投回地里去打新井。
3. 最关键的:债务利息与杠杆(约 $10-$15/桶)
- 债务状况: 截至 2026 年 Q1,公司净负债约 $2.57 亿,且有大量的 F 系列优先股需要处理。
- 利息支出: 在目前的高利率环境下,每年的利息支出和债务偿还压力摊薄到每桶油上,大约需要 $10-$15 的利润空间来覆盖。
4. 汇总:为什么 $60 是生死线?
$运营成本 ($16) + 维持性开支 ($22) + 债务/利息 ($12)=$50 (基础现金成本)
$50只是“勉强活着”。如果油价跌到 $60:
- 净利润消失: 考虑到油价贴水(实际卖出的价格通常比 WTI 原油便宜几美金),$60 的国际油价意味着公司实际到手可能只有 $55 左右。
- 现金流断裂: 在 $60 左右,公司赚的钱只能刚好够付工人工资和维持产量,完全没有余力去偿还本金或应付债务利息。
所以油价 $60 是生死线,在这个生死线上,
Prairie Operating (PROP) 做了非常激进且大比例的套期保值(Hedging),锁定了利润,减少了自己破产的概率,同时也限制住了利润的爆发。
根据 2026 年 3 月底发布的最新财报和 2026 年业绩指引,
公司在 2025 年报中明确指出,已经针对 2026 年至 2029 年 的大部分预期产量锁定价格。套保锁定了 2026 年约 2.4 亿-2.6 亿美元 的 EBITDA(税息折旧及摊销前利润)。它才 1.1 亿市值。
值得注意的是套期保值(Hedging)是逐年递减的。
|
年份 |
原油套保量 (Bbls) |
天然气套保量 (MMBtus) |
锁定价格 (WTI) |
|
2026年 |
4,230,866 |
13,420,634 |
~$62.36 |
|
2027年 |
3,306,753 (约2026年的78%) |
11,882,126 |
~$62.03 |
|
2028年 |
1,515,007 (约2026年的35%) |
4,406,357 |
~$61.60 |
根据套保量:
2026年:高度确定,但没爆发力。 公司今年大约 60%-70% 的产量已经被锁死在了 62 美元左右。这意味着即便今年油价涨到 100 美元,公司赚的钱也是提前定好的。它的主要任务是还债和支付 2 亿美元的资本开支。
2027-2028年:开始“解套”,迎接弹性。 套保比例大幅下降。这意味着从 2027 年开始,如果油价依然维持在高位,PROP 卖出的每一桶油中,“随行就市”的比例会大大增加。如果到时候油价是 80 美元,它的利润会比 2026 年出现爆发式增长。
为什么价格都锁在 $62 附近?
你会发现它所有的套保价格都非常接近($61-$62)。这是因为 PROP 的债主(贷款银行)通常会要求一个**“盈亏平衡保险”**。银行算准了公司只要能按 62 美元卖油,就绝对不会倒闭,能还上利息。
现在的 1.1 亿市值,未来2年是一个**“分阶段解锁”**的剧本:
- 第一阶段(2026):“还债”。股价的表现取决于它减债的速度快不快。
- 第二阶段(2027-2028): 假如活过了2026年,“远期油价”释放利润。如果油价坚挺,由于套保比例降低,这时的 PROP 才会真正展现出能源股的暴利属性。
2026 年业绩弹性模拟
1. 核心模拟参数 (2026 预测)
- 总产量目标: 约 985.5 万桶油当量 (BOE) (取中位数 27,000 BOE/日)。
- 原油比例: 约 50%(即 493 万桶原油)。
- 套保头寸: 2026 年已套保 423 万桶 原油,均价 $62.36。
- 裸奔产量 (Unhedged): 约 70 万桶 原油完全随行就市。
- 刚性支出: 资本开支 (CapEx) 约 $2.1 亿 + 运营成本约 $1.5 亿 + 利息/税等。
2. 2026 年业绩弹性压力测试 (WTI 油价)
由于公司约 86% 的原油产量已被锁定在 $62 附近,油价上涨对 2026 年利润的提振非常迟钝。以下是不同油价下的模拟估算:
|
WTI 油价 |
2026 营收估计 (含天然气/NGL) |
调整后 EBITDA 估计 |
自由现金流 (FCF) |
评价 |
|
$60 |
约 $3.9 亿 |
$2.4 亿 |
~ $0.1 亿 (盈亏平衡) |
生存模式: 刚好够打井和还利息。 |
|
$70 |
约 $4.1 亿 |
$2.5 亿 |
~ $0.2 亿 |
缓慢去杠杆: 有少量闲钱开始还本金。 |
|
$80 |
约 $4.3 亿 |
$2.6 亿 |
~ $0.3 亿 |
稳健: 现金流变好,减债压力减轻。 |
|
$90 |
约 $4.5 亿 |
$2.7 亿 |
~ $0.4 亿 |
被套保拖累: 涨了 $30 但利润只增了 $0.3 亿。 |
|
$100 |
约 $4.7 亿 |
$2.8 亿 |
~ $0.5 亿 |
错失行情: 绝大部分涨幅都捐给了对冲对手。 |
3. 为什么 2026 年“涨不动”?
从上表可以看出,油价从 $60 暴涨到 $100(涨幅 66%),但公司的 EBITDA 仅从 2.4 亿增加到 2.8 亿(涨幅仅 16%)。
- 套保的“紧箍咒”: 2026 年是 PROP 债务压力最大的一年,所以管理层几乎把“命”都押在了 $62 这个保底价上。
- 市值 1.1 亿 vs EBITDA 2.5 亿: 即使在 $60 油价下,其 EV/EBITDA 估值也仅约 2 倍(含债)。这意味着它现在这么便宜,不是因为它不赚钱,而是因为市场在担心它能不能把那 2.5 亿的债还上。
4. 结论与概率思维
- 2026 年:看戏。 无论油价多少,它今年的净利润大局已定(约 $0.55 - $0.65 亿),看到这个结论我还是惊讶于现在1亿的市值。股价能否上涨,不取决于油价,而取决于它债务降低的速度。
- 真正的弹性:在 2027-2028 年。 随着套保量减半,那时如果油价在 $90,它的利润会直接翻倍,那才是市值从 1.1 亿向 5 亿甚至 10 亿跨越的时候。
2027 年就是它的“利润释放年”。
2027 年的模拟逻辑发生了质变。最核心的两个变化是:套保量“腰斩”和债务负担减轻。
1. 2027 年模拟核心数据 (估算)
- 套保比例: 原油套保量从 2026 年的约 423 万桶下降到约 330 万桶(减少了约 100 万桶的束缚)。
- 裸奔产量 (Exposure): 随行就市的比例从 15% 提升至 30% 以上。
- 营收预期: 分析师共识预期 2027 年营收将增长至 4.5 亿-5 亿美元,EBITDA 预计提升至 3.4 亿-3.6 亿美元。
2. 2027 年业绩弹性压力测试 (对比 2026)
在 2027 年,油价上涨对股价的拉动作用将比 2026 年显现出更大的“杠杆效应”:
|
WTI 油价 |
2027 EBITDA 估计 |
自由现金流 (FCF) |
相比 2026 的变化 |
|
$60 |
约 $3.1 亿 |
约 $0.6 亿 |
大幅好转: 即使油价不涨,利息少了,钱就多了。 |
|
$70 |
约 $3.4 亿 |
约 $0.9 亿 |
开始赚钱: 能够进行更多的资产收购或分红。 |
|
$80 |
约 $3.8 亿 |
约 $1.3 亿 |
爆发: 现金流是 2026 年同油价下的 4 倍 以上。 |
|
$90 |
约 $4.2 亿 |
约 $1.7 亿 |
弹性释放: 开始享受高油价带来的溢价。 |
|
$100 |
约 $4.6 亿 |
约 $2.1 亿 |
单车变摩托: 自由现金流超过公司目前的总市值。 |
3. 为什么 2027 年是“暴利”的起点?
- 债务利息“退潮”:根据 2026 年 4 月 9 日的最新公告,公司已经提前偿还了 1370 万美元的 F 系列优先股本金,并大幅削减了权证稀释额。到了 2027 年,由于 2026 年赚的钱主要用于还债,利息支出会大幅下降,省下的利息直接变成了利润。
- 套保成本“松绑”:2026 年你卖 100 块的油,只能拿 62 块;2027 年,你有更多的油可以按 80、90 块甚至 100 块卖掉。这种“剪刀差”的扩大是 2027 年估值翻倍的动力。
- 产量稳定期:经过 2026 年的密集打井(CapEx 2.1 亿),2027 年公司进入产量的收割期,资本支出压力会相对减小。
既然2027年是暴利的起点,那么关键就是2026年能活过去吗?
1. 2026 命悬一线的“三座大山”
目前 PROP 能不能活,主要看这三个变量:
- 资本开支 (CapEx): 2026 年预计投入 2 亿 - 2.2 亿美元。这是为了维持产量必须打井的钱,省不了。
- 债务与股权稀释: 公司欠债约 2.57 亿美元。
- 现金流匹配: 2026 年预估 EBITDA 为 2.4 亿 - 2.6 亿美元。
2. 概率模拟:2026 能活吗?
场景 A:惊险过关(概率:75%)
- 逻辑: 只要油价不持续低于 $60,套保(锁定在 $62)就能提供稳定的保底现金流。
- 生存状态: 2026 年公司赚的钱(2.5 亿 EBITDA)减去打井的钱(2.1 亿 CapEx),剩下的 4000 万美元 刚好够付贷款利息和维持公司运转。
- 结论: 活得会非常憋屈,没有任何分红,股价会因为不断处理认股权证(Warrants)带来的稀释而低迷,但公司本身不会倒闭。
场景 B:债务重组/被动稀释(概率:20%)
- 逻辑: 油价跌破 $60 且持续数月。
- 生存状态: 即使有套保,公司的现金流也会极其紧张,无法同时支付打井款和银行利息。公司可能被迫再次大规模增发股票来还债。
- 结论: 公司还在,但普通股股东的每股收益可能因为疯狂增发而缩水 50% 以上。
场景 C:破产清算(概率:5%)
- 逻辑: 油价跌破 $50 叠加 银行提前抽贷。
- 结论: 对于市值仅 1 亿的公司,这种概率虽小但存在。
3. 为什么我认为它“大概率能活”?
- 套保覆盖率极高: 它 2026 年 86% 的产量都锁死了。这相当于给公司买了一份重疾险,只要油田不出事故,这笔钱是稳拿的。
- 刚处理完“股权炸弹”: 就在 2026 年 4 月初,公司刚刚和 F 系列优先股股东达成了协议,将潜在的 7700 万股稀释压力降到了 3400 万股,并延期了权证行权时间。债主也想留着它慢慢还钱释放潜力。
综合以上2026年大概率能活,小概率破产,2027年利润释放的路径,我的策略:期权思维-先小量建仓-公司稀释后再次加仓
小量建仓意味着即使发生那 5% 的“破产极端情况”,我的总仓位损失也是可控的,这符合“有限损失,无限收益”的期权特征。
为什么要稀释后加仓?稀释后公司存活到2027年释放利润的可能性增高,加仓在确定性增强的时候。
重点关注以下三个信号:
- 信号 A:2026 年 7 月 8 日(权证重置期): 这是公司之前协议中关于稀释压力的关键节点。
- 7月8日前后(动作时刻):
- 如果公告说“权证取消”: 风险瞬间归零,哪怕价格涨了也要追涨加仓,因为通往 2027 年的爆发之路彻底扫清了。
- 如果公告说“权证发行”: 等待股价由于稀释带来的最后一跌(Final Washout),跌透了之后进场,因为此时公司虽然股本变大了,但违约风险也随之消失了。
- 信号 B:2026 年 Q3 财报(运营成本验证): 观察其 LOE(租赁运营费用)是否能维持在 $6 左右。只要运营成本不失控,套保就能稳稳覆盖打井开支。
- 信号 C:债务偿还进度: 只要看到公司利用 2026 年的现金流开始注销本金或优先股,每一分钱的债务减少,都直接转化为未来手里股权价值的增加。
最后,我再回到这家公司的价值:
油田储备价值 (PV-10): 截至 2025 年底,PROP 在 DJ Basin 的探明储量(Proved Reserves)价值约为 $12.2 亿(以 PV-10 贴现值计算)。
截至今天2026年4月25日的市值:1.12亿
- 极强的“被动防御”: 即便 PROP 经营不下去,它的资产也是硬通货。如果它破产清算,12 亿的资产卖掉还完 3.6 亿的债,剩下的钱依然远远超过目前的 1.1 亿市值。
- 极高的“被收购潜力”: 这种“资产大、市值小、债多”的公司,是大型油气公司(如 Chevron 或 Occidental)最喜欢的猎物。一旦被溢价收购,股价会回归到资产价值。
- 时间是朋友: 随着 2026 年这 200 多口井陆续出油,只要它能把那 3.6 亿的债慢慢还掉,那消失的 11 亿价值(12.2 亿资产 - 1.1 亿市值) 就会像“地壳抬升”一样,把股价顶上去。
Risk Warning: This post is a result of personal study and does not constitute financial advice. I am currently in the process of learning translation, so there may be inaccuracies in the language used.
Position Disclosure: As of the time of publication, the author holds a position in this company. This is the reason I chose to research this topic. The author has no plans to trade this stock within the next 72 hours.